

This article is part of a six part series. Read the full series:
1. Government Policy & Rental Supply | Rental Housing Supply 1
2. Ottawa’s Historical Renting Data | Rental Housing Supply 2
3. Corporations | Rental Housing Supply 3
4. Individual Investors | Rental Housing Supply 4
5. Rent Control | Rental Housing Supply 5
6. Final Recommendations | Rental Housing Supply 6
We used to have affordable rental housing in Ontario. However, approximately 50 years ago something went terribly wrong, and it wasn’t subtle. Prior to 1972, the rental market was aggressive with purpose-built rental housing creation and high vacancy rates (~6%). Then abruptly, this purpose-built construction began to decline at a rapid pace, alongside vast drops in vacancy rates until they were around 1% by 1975. Since that time, successive governments have struggled with creating effective policies to return some balance to the market. Although people often point to rent controls as the primary culprit, this series will uncover two other major contributors to the problem. Additionally, it will show that simply removing rent controls without addressing the other aspects will not in itself make rental housing more available.
In this 6-part series, we will be exploring how government policy has negatively impacted the creation of rental housing. Just as well, we will analyze the potential improvements to the current situation that may arise through specific adjustments to laws, incentives, and strategic policy frameworks.
Notwithstanding the recent impacts of the COVID-19 pandemic, rental housing stock has been under constant pressure to grow in accordance with the macro–economic trends.
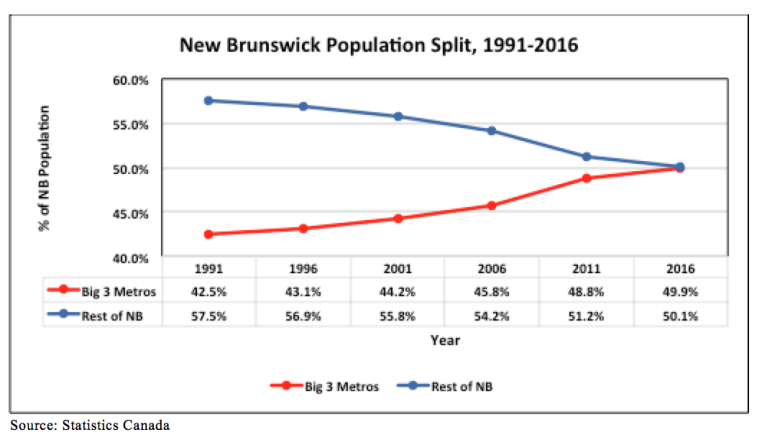
The first of these trends is rural to urban migration. As you can see in the figure below, Canada’s population has been slowly becoming more urbanized. As of 2019 the urban population stands at 81.48%. Not unexpectedly, the distribution of this migration is not even across the country. In Ontario, the degree of urbanization is closer to 88% while in New Brunswick it is approximately 50%. As this migration continues, it puts additional pressure on urban housing stock availability due to former rural inhabitants becoming urban inhabitants.

![]()
Figure 1: Urban population percentage by year
The second of these trends is immigration. For various policy reasons, Canada has the largest immigration rates per capita of any other country. Without immigration, Canada’s population would be declining with an average fertility rate of ~1.517 as of 2019 [8]. In order to sustain the population, each woman would need to give birth to 2.1 children. Immigration offsets this decline resulting in a net increase in population of 1.4% (the long–term population growth is ~1% per year) in 2019.[5][6]

Source: OECD International Migration Database 2020[9]
Figure 2: Total Immigration (Canada) by Year
The third trend relates to Millennial and Baby Boomer demographics. While not all Baby Boomers are downsizing, a significant proportion are selling their existing homes to release the capital (cash) within the property and then either acquiring a smaller home or moving directly to rental accommodations. When Baby Boomers move to rental accommodations, nearly all of their capital is freed up and invested in other more liquid assets. Conversely, Millennials are delaying the purchase of new homes for a variety of reasons such as their generation’s priority shifts vs earlier generations and affordability. This results in this younger generation staying in rentals longer than previous generations.
As will be discussed in more detail in subsequent sections, there are a number of negative factors propagating the creation of new rental housing stock. Three of the most influential areas relate to government policy.
The first influencer was the introduction of capital gains taxes in 1972, which tightened the profits of merchant apartment developers. Ceteris paribus, this new variable would have increased the sale price (and hence rent prices) to offset the shrinking profit margins. Unfortunately, it also motivated developers to consider alternate investment vehicles enabled by the then recently enacted condominium act in 1967 and home buyer incentives. A second policy decision was that the capital gains cost–base was not indexed to inflation. Ergo, the longer an owner held the asset, the more tax they paid purely on inflation as opposed to any value they have added to the asset. When evaluating a business case with metrics such as the commonly used internal rate of return (IRR), inflation is factored in. While this is highly correlated with the reduction in purpose–built rental housing, successive governments at all levels have continued to add to development costs, often referred to as soft costs. This refers to costs such as permits, development fees, taxes, and engineering fees to support certain regulatory processes. A less obvious variable is the impact of regulation (e.g. building codes) which can add additional requirements to be built into a building. In most cases these regulations exist for good reason, but they do have an impact on construction cost.
As just identified, the second influencer was the creation of the condominium act in 1967, which legalized their creation. Suddenly there was an alternative to creating purpose built rental housing which also had a better business case (discussed in a subsequent article). This was partially offset by various programs that aided individuals to buy their own home who then had more access to capital to invest in rental housing. This resulted in the rapid growth of a class of individual investors who now make up more than half of the rental housing market.
The third area relates to residential housing regulations such as Ontario’s Residential Tenancies Act and more local municipal by-laws. While there is little debate that the intentions are good and meant to better protect tenants, the way many of these laws are created is causing an imbalance where rental housing providers are taking on additional risk. This is particularly acute with new entrant rental housing providers (the individual investors) who bear a disproportionate amount of the risk. As will be described in later sections, this is where a major impact occurs but is also one of the areas of highest leverage to correct the current problems. Ironically, the laws meant to better protect tenants are having an impact on rental housing supply and affordability.

![]()
Figure 3: Ontario Housing Starts (1969-2016)

![]()
Figure 4: Toronto Housing Completions (1981-2016)
Population growth within Canada will continue to grow and it is not likely that this can or should be abated. The priority then is on creating policies that enable housing creation as opposed to deter it.
The increased back pressure on housing creation is what is driving availability which in turn impacts affordability. But even beyond the additional cost of rental housing, stringent tenancy laws have a disproportionate negative impact to the most vulnerable in our society. When rental housing providers assume additional risk, it is normal human behaviour to mitigate that risk. Small individual (mom and pop) landlords bear a disproportionate amount of that risk and thus are much more likely to establish procedures such as selecting what they perceive to be lower risk tenants. Irrespective of whether this is a correct perception, it cannot be denied that these negative externalities will be largely felt by the vulnerable in our society.
The final irony is that as these pressures increase, they create barriers to entry in the rental housing market, resulting in the reduction of new entrants as rental housing providers. In turn, those that successfully remain in the industry (usually the larger providers) see less competition, lower vacancy rates, and stronger revenue.
In the subsequent sections, we will delve deeper into each of these areas to better understand how these policies influence the creation of rental housing and how they can be adjusted to improve rental housing creation.
Rural to Urban Migration in charts:
[1] https://www12.statcan.gc.ca/census-recensement/2006/as-sa/97-550/figures/c5-eng.cfm
[2] https://www.statista.com/statistics/271208/urbanization-in-canada/
[4] https://www.aims.ca/wp-content/uploads/2017/04/NB_urbanization_graph.png
Population and Demographics:
[5] https://www.statcan.gc.ca/eng/subjects-start/population_and_demography
[7] https://www.oecd-ilibrary.org/sites/184a3868-en/index.html?itemId=/content/component/184a3868-en
[8] https://www.macrotrends.net/countries/CAN/canada/fertility-rate
[9] “International Migration Database”. stats.oecd.org. Retrieved 2020-08-25.
Design by NIOMA


